The three criteria for a neighborhood matching your business
- Seek neighborhoods with a decent market size, meaning the number of cars per household and the number of households are reasonably high. A good benchmark is about 3,000 cars per neighborhood for an all-makes-all-models auto repair business.
- The median household income is above $80k; in neighborhoods with high living costs, it increases to $100k+ per household.
- If existing customers are in the neighborhood, there are no hurdles like time to drive or being far from typical daily commuter routes. Existing customers confirm that this neighborhood is worth pursuing.
BizMapIQ has been created to identify those neighborhoods and develop a marketing strategy with your website provider and/or marketing agency.
The Three At-A-Glance Steps of Determining the Right Neighborhood(s)
Step 1 Logging into BizMapIQ
If you are an existing AutoTechIQ client, just click on 'login' in the upper right corner of BizMapIQ.com and use the email address the AutoTechIQ staff uses to communicate with you. Once logged in, you will see at the top right how many customers BizMapIQ has imported for your business.

- shows all active customers. These customers have visited your business at least once in the last three years.
- shows all customers BizMapIQ couldn't identify a Google GeoID for (most likely incomplete or wrong addresses in the PoS) or they don't live in any of the 250 neighborhoods surrounding the business location.
Step 2 Performing a Local Analysis for a Search phrase
Assuming you own an all-makes-all-models auto repair shop, the following search phrases represent the Top Ten search phrases nationally (the approximate monthly search volume is in parentheses).
| mechanic | 135,000 |
| auto repair | 74,000 |
| oil change service | 74,000 |
| car ac repair | 49,500 |
| Truck Repair | 27,100 |
| transmission repair | 22,200 |
| brake repair | 18,100 |
| Alternator repair | 5,400 |
| engine repair | 5,400 |
| Toyota repair | 3,600 |
Note that selecting exotic search phrases, e.g., "fleet repair," will make your web presence look awesome, assuming it is optimized for it, but won't create the necessary traffic to your website. Ensure your web presence is optimized for the most demand = high volume search phrases.
Auto repair shops specializing in European or Asian makes should select the most common make and combine it with the term "repair", e.g., "Honda Repair"
Enter the search phrase and hit 'Scan" to start the Local Analysis. (see image below)

Typically, the numbers will be crunched in about 10 minutes. Once the local analysis is ready for review, you will receive an email. A card will be added to your welcome screen (see image below)

Step 3 Review the Local Analysis
Once you click on the local analysis, you will see a map with 250 neighborhoods around the business location. There are four views you can select from
- Hybrid View of Local Pack and Organic
- This View is the overall assessment of your GBP and Website
- Local Search
- This view measures the ranking of your GBP in Google Maps
- Expected CTR (Organic Search)
- This view is the assessment of your website
- Expected CTR (Local Pack)
- this view is the assessment of your GBP in Google Search
CTR stands for Click-Through Rate, and it measures how many % of the viewers of the Google Search results will click on either one of your website pages or the GBP. Any CTR over 15% is considered great. This article explains the CTR calculation and the differences between the abovementioned four views.
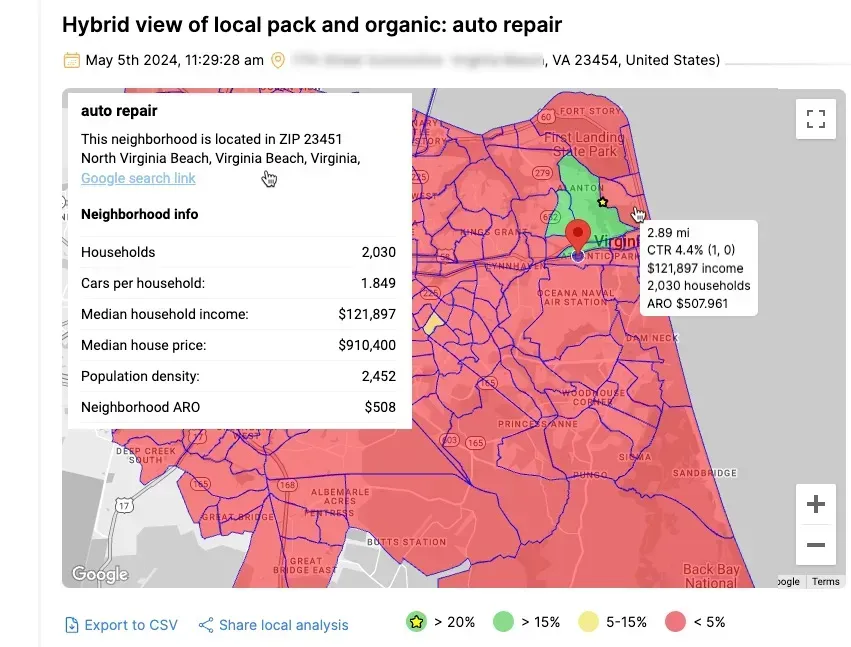
Let's focus on the Hybrid view since it combines the power of your website and your GBP for the chosen Search Phrase.
as you move the cursor around your shop location, you immediately see your CTR by color and value and
- the distance of the neighborhood from the business location
- the median household income in the neighborhood
- the number of households
- the neighborhood ARO for the business
These four data points allow you to hone in on the most attractive neighborhood by simply moving the cursor across the map and determining the best neighborhoods and how your CTR is. If it is lower than 15% and you have existing customers in that neighborhood. The median household income and number of households are attractive, and you should share that analysis with your website provider and ask for a meeting to review the findings.
Clicking on the neighborhood gives you more details; see the image below.

- This marks the location of the business.
- The cursor is on a neighborhood only 3 miles from the business. The CTR is only 4.4%, but it has a high chance of 15% or more once the GBP starts ranking in this neighborhood.
- The market size is almost 4,000 vehicles in this neighborhood.
- Existing customers in this neighborhood paid, on average, $508 per shop visit.
The Opportunity Overview
As a business owner, you would like to see all neighborhoods at a glance and see what opportunities are available.
BizMapIQ offers filters for that. For example, assume that the above business considers $90k+ as a perfect median household income to market to, as well as 10 existing customers in a neighborhood, a great indication of people driving to the shop from that neighborhood.
Let's show all neighborhoods with $90k+ median household income and 10+ existing customers on one map.

After selecting the filter mode in BizMapIQ,
- move the slider to the median household income of $90k,
- move the slider for active customer count to 11
- You can see on the map that all neighborhoods match this filter. Export all of them into a spreadsheet.
- Note that the two neighborhoods spotlighted on the southern section of the map are 8 miles from the business location. It is highly recommended that postcard campaigns be run in these neighborhoods first to test whether customers are willing to drive 8 miles or more before asking the web presence company to promote the business in these neighborhoods.
- On closer look, the neighborhood of the two further west has more than three times the number of households. This neighborhood is the better 'bang for the buck' opportunity of the two. And its Neighborhood ARO is higher, too.
Other news
-
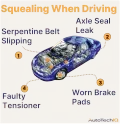
Car is Squealing When Driving
-
What is Preventative Maintenance and What Are The Benefits of it?

-
JobViewIQ - DVI Process Training - Part of the Auto Care Alliance Benefits

-
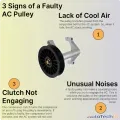
7 Signs of AC Pulley Issues
-
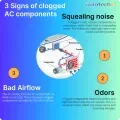
7 Signs of Clogged AC Components
-
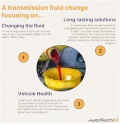
How Much Does a Transmission Fluid Change Cost?
-
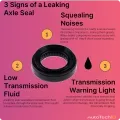
7 Signs of a Leaking Axle Seal